
In 2017 we joined our arena hockey pool as Tre Kronor. Our draft strategy that season was to only select players who were from Sweden. The formula worked out pretty well, considering we finished in third place and only lost in the semi-finals because our goalies didn’t play enough games. We followed the same exact plan for our second season to much worse results. We finished near the bottom of the league and didn’t pack the same punch we did before. As 2019 approached, we decided to scrap the whole Team Sweden idea and draft like everyone else.
This past season may have been a tad bit better than the previous one, but for the second straight year, we failed to make the playoffs. Because of that, we once again threw our money to the wind. However, what we did achieve this season was our desire to analyze all 21 weeks of the season to see whether they have the right players or the wrong manager. They say fantasy sports is just a game of chance, but we want to believe that there is some strategy to it. So far, we have yet to find that winning formula, so let’s see where all our errors lie.
Team Statistics
Let’s start with our overall production numbers. Our league had 12 categories in every matchup. They were goals, assists, points, plus/minus, power-play points, game-winning goals, shots on goals, and hits. For the goalies, wins, goals-against average, save percentage, and shutouts.
As our final numbers would indicate, we were a terrible team and did not deserve to finish in 9th place. We were the ninth-ranked team in goals (209), which was 38 goals out of first place. As a team, we only had 272 assists (last place), which equalled to be 157 out of first. When you add up the points, we had a combined 481 (last place), a whopping 160 points from the top. You would think that the worse was over, but we combined -63 as a team. The league leader was +61, which equalled a difference of 124. So for those keeping track at home, we would have to have scored an extra 124 goals without giving up any. Another weak spot of ours was power-play points, where 126 points landed us in last place, 96 points behind the leader of the pack (222).
Our numbers progressed a little after that. We 35 game-winning goals on the season, only six behind the leader (41), but our total only allowed for a ninth overall finish. We contended in the shots on goals category all year before stumbling a bit towards the end. Our 2037 total was 117 from the first place, which landed us in the sixth spot. Our best offensive category was hits. We played near the top all season long before settling on third place with 1097, only 118 from winning that crown.
People mocked us for carrying four and five goalies all season long. We figured if we didn’t win the offence, might as block everyone from winning the goalie categories. There were mixed results in the numbers since we were great at somethings and not so great at others. We finished with 79 wins, most in the league. Surprisingly we left 17 wins on the bench, so imagine the final numbers if everyone played! With 10 shutouts, we tied Adam’s Team in that department but finished in first anyways. Goals-against average (10th place) seemed to be our Achilles heel when it came to the goalie statistics. Our 2.75 GAA was 0.13 points out of first place, while our 0.913 save percentage (4th place) was just 0.006 behind the leader.
Categories & Projections

As we continue to break down the numbers, here’s a recap of every matchup. The blue colours were categories we won, grey colours were ties, and of course, white colours were losses. Like we mentioned in the previous section, there is a whole lot of white in the offensive categories and a lot of blue in the goalie ones.
We will spare you all the details about how many points we average every week, but if you were curious, the numbers are right there at the bottom of the spreadsheet. The numbers we do want to talk about are projections and the final outcomes. They were not pretty.
We failed to record our potential in almost all 12 categories. In regards to goals, we missed the mark by precisely 100. After that, we were off by 195 assists, which meant we underperformed for 295 points! We were supposed to be +92, yet finished -63, which was a difference of 155. Despite being the worse power-play unit in the league, we finally got under triple digits with 86 fewer points than projected. Game-winning goals managed to be the closest we got to meet any projections, just missing the mark with nine. As we return to the big numbers, we missed shots on goal by 910 and hits by 451. (Fahrenheit 451 is an excellent book if anyone needs something to read in the offseason).
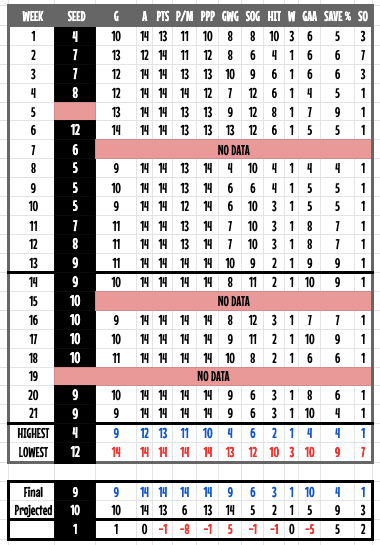
Even though we ran with an obscured number of goalies, we also failed in some of those categories too. Somehow we missed our win total by 27, which meant we still missed it by 10 if you factor in the 17 wins left on the bench. The projected GAA was tough to figure out, but it equalled some crazy number like 6.95. We finished at 2.77, which meant an improvement of 4.18, although we’d be the first admit we don’t know if we won or lost that category. We came ever so close (0.003) points away from matching the save percentage projections. As fate would have it, we managed to secure 10 shutouts, just like Yahoo projected. It only took five guys to pull that off.
If you look at the chart on the right, you’ll see we failed at meeting many other projections. The numbers break down like this. We were projected to finish the season in 10th place. We defied the odds for some time, sitting in the top five, with our highest spot, 4th place. We stumbled at times and dropped down to 12th place, but we stayed within 9th/10th place for the majority of the second half.
We will spare you all the details in regards to every category projections and final spots, but you can see from yourself that we missed many of those goals too.
Studs and Duds

There were a total of 22 studs during our 21 week season. Washington Capitals captain Alex Ovechkin took home the crown a total of 10 times while recording the best week (49 points) in the second week of the season. His closet competition was New York Ranger Mika Zibanejad, who collected five weekly awards himself.
Players want to contribute to their team every week, but when you are a dud, it is tough to stay in the lineup. New Jersey Devils’ first overall pick Jack Hughes was cut shortly after collecting five dud awards in just the first eight weeks. We hung onto Boston Bruin captain Zdeno Chara despite the fact he managed four bad weeks in the final nine. Anaheim Duck captain Ryan Getzlaf also stuck around despite racking up three bad weeks on his own.
Leading Scorers

When we break down the overall leading scores of our team, the top six players were all drafted at the beginning of the year. The seventh and eighth-best scorers were acquired in a trade while two free agents rounded out the top 10. After Zdeno Chara (12th overall), no one else contributed more than 100 points, with many of them playing less than 25 games for the team.
Mike Zibanejad was our all-star this season, leading the team with 33 assists, 27 power-play points, six game-winning goals and 72 points. Alex Ovechkin may have piled up 223 more points, but he only leads the team in goals, shots on goal, and hits. Our best plus/minus players were Chara and Shea Theodore, with a +13 rating.
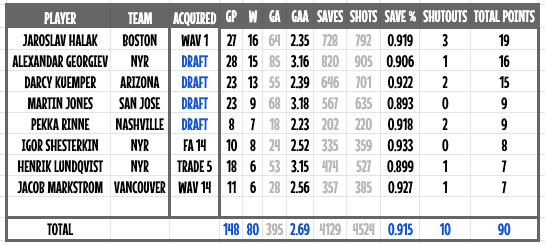
Our best goalie (although it is tough to calculate each guy’s performances) had to be Boston Bruin Jaroslav Halak. He was our first signing of the season right after the entry draft when we realized he wasn’t selected. He led the way with 16 wins and 3 shutouts. Next up was Pekka Rinne (Nashville Predators), who had the best GAA (2.23), although he only played in eight games. New York Rangers rookie sensation Igor Shesterkin had the best save percentage (0.933) despite only playing in 10 games.
Daily Winning Percentages & Bench Players
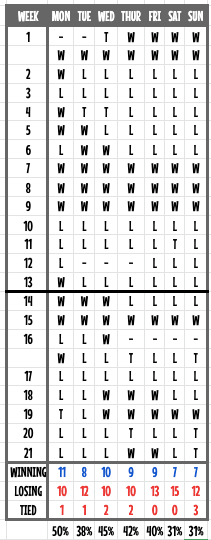

The following chart will show you that the best day of the week was the first day of the week. We were ahead (winning) in the matchup about 50% of the time. Except for Tuesday (38%), we stayed in the 40% range on Wednesday, Thursday, and Friday. As the weekend rolled around, that was about the same time we turtled (31% winning percentage) in the matchup, which resulted in our losing record.
Since we started to compile fantasy statistics during the 2018 baseball season, we have always been fascinated with the number of points we didn’t score. In our weekly recaps, we always talk about how many points we didn’t score and whether or not it could have affected the final outcome of the matchup. For recap purposes, we listed every week in the spreadsheet on the right. Compared to the other hockey league we are in, those numbers really wouldn’t have impacted our season.
Head to Head Results


There were 14 teams in our league this season, which meant we had 13 opponents. Out of all those matchups, we posted a winning record against only one of them, Willie’s Wee Turtles (1-0-0). After that, we played several teams and posted 1-0-1 records against – Nailed to the Boards and MP. We split a handful of matchups against Killer Bs and Pray for Mojo. We went winless against Lecavalier’s bios and Gregory’s Team (0-2-0).
When it comes to matchup scores, we played our best against MP (16-5-1) and our worse against Adam’s Team (1-8-3). We produced winning matchup scores against Killer Bs, MP, Nailed to the Boards, Willie’s Wee Turtles. In regards to the final eight teams, we were outscored when the final numbers came in.
Final Analysis
We were on a mission at the start of the 2019-20 fantasy season, we wanted to produce a winner in our last season. Unfortunately, that didn’t happen for the second straight year. As we say goodbye to the King Bros league, we want to thank everyone for the memories.

